Among the funds for sale in the Hong Kong universe, Pictet’s Russia fund was the best performing for the full year 2016, according to FE data. Another Russian fund, managed by HSBC Asset Management, was also among the top five best performing funds.
One year: 31 Dec 2015 – 31 Dec 2016
| Best performing funds | Worst performing funds | ||
| Pictet Russian Equities in US | 73.44 | Janus Europe in US | -33.47 |
| Allianz Global Metals and Mining TR in US | 61.12 | Invesco Korean Equity TR in US | -25.82 |
| Parvest Equity Brazil in US | 59.80 | BOCHK China Golden Dragon in US | -23.90 |
| HSBC GIF Russia Equity in US | 59.35 | CSI RMB China A-Shares Diversification in US | -23.22 |
| Invesco Gold & Precious Metals in US | 58.67 | HS China A-Share Flexipower in US | -21.88 |
Source: FE Analytics
Russia’s recession is slowing down. Its GDP shrank by just 0.9% year-on-year in the first half of 2016 compared to -3.7% in 2015, according to data from the World Bank.
For the full year 2016, its stock market was up at around 27%, according to SFC’s review of global and local securities markets.
East Capital, Eastspring Investments and Franklin Templeton, are optimistic on Russian equities.
Like Russia, Brazil’s recession is expected to slow. Estimates from an OECD report shows that there will be no change (0%) in the GDP in 2017 from a continuous decline of -3.9% in 2015 and -3.4%. in 2016. GDP is estimated to rebound by 1.2% in 2018.
In 2016, Brazil’s stock market surged to almost 40% in 2016, according to the SFC review.
China cellar
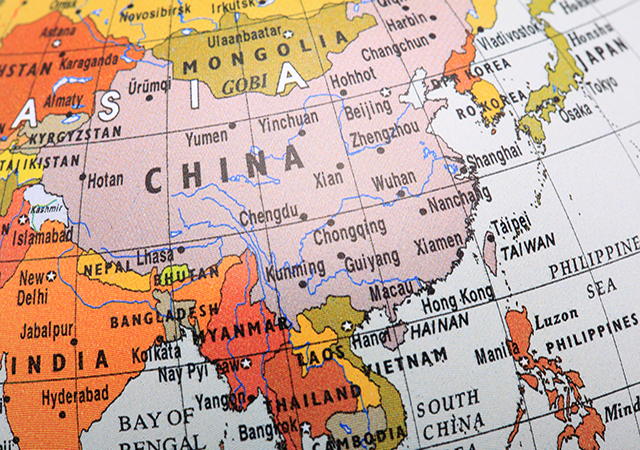
On the flipside, three of the year’s worst performing funds were focused on China equities, data from FE shows.
The Chinese stock market performed poorly during the year, with the Shanghai and Shenzhen Composite indices slumping by -12.3% and -14.7%, respectively, according to the SFC report.
The Chinese market was volatile given worries about a succession of bubbles across different asset classes and regulatory tightening to address market risks, the SFC said. In addition, the market dropped in early 2016 amid worries and uncertainties about the economic outlook and a weakening of the renminbi.
India at the top
Using a three-year horizon to end-2016, four India funds were among the best five performers.
Three years: 31 Dec 2013 – 31 Dec 2016
| Best performing funds | Worst performing funds | ||
| JPMorgan India Smaller Companies in US | 84.65 | Janus Europe in US | -45.73 |
| PineBridge India Equity in US | 64.93 | Schroder ISF Global Energy in US | -43.47 |
| Allianz China A-Shares in US | 56.19 | Alquity Africa in US | -39.28 |
| First State Indian Subcontinent in US | 55.37 | MFS Meridian Latin American Equity in US | -35.78 |
| JGF-Jupiter India Select in US | 54.53 | Investec Global Energy TR in US | -35.50 |
Source: FE Analytics
In terms of sectors, India equities were the best in both Hong Kong and Singapore, returning more than 20% over three years, as reported.
Jonathan Reoch, Blackrock’s lead product strategist for Asian equities, said last month that although India was part of the fragile five markets three years ago, it has become a favourite given a positive outlook driven by growth and adjustments in current and fiscal accounts.
The execution in structural and policy reforms in the market has also driven its economy, Kevin Anderson, State Street Global Advisors’ Hong Kong-based head of investments for Asia Pacific, said earlier.
However, Mark Mobius, executive chairman of the Templeton emerging markets group, recently told FSA that its demonetisation in November may result in a decline of GDP growth.
“People have to change their bills for new ones by the end of the year and this is a big drag on commerce.”
Gold loses shine
Over a five-year horizon, to end-December 2016, fund that were focused in gold or precious metals were the worst performers.
Five years: 31 Dec 2011 – 31 Dec 2016
| Best performing funds | Worst performing funds | ||
| Franklin Biotechnology Discovery in US | 141.82 | Amundi Equity Global Gold Mines in US |
-63.32 |
| Legg Mason Opportunity in US | 135.58 | Franklin Gold and Precious Metals in US | -53.67 |
| JPMorgan India Smaller Companies in US | 127.81 | Allianz Global Metals and Mining TR in US | -50.21 |
| Janus Global Life Sciences in US | 125.84 | Blackrock GF World Mining in US | -49.39 |
| Invesco Global Leisure in US | 123.80 | Investec Global Gold TR in US | -48.28 |
Source: FE Analytics
Despite the five-year performance of gold funds, Ned Naylor-Leyland, OMGI’s fund manager of the Old Mutual Gold and Silver Fund, told FSA recently that he is positive on gold this year.
“The relationship between rates and inflation is what matters. If inflation is at 4% and interest rates 2%, then you’re losing 2% per year holding cash.”


