It is a truth universally acknowledged, that investors in possession of a good fortune must be in want of a tracker fund. But not, it seems, in the single most popular equity market—the US.
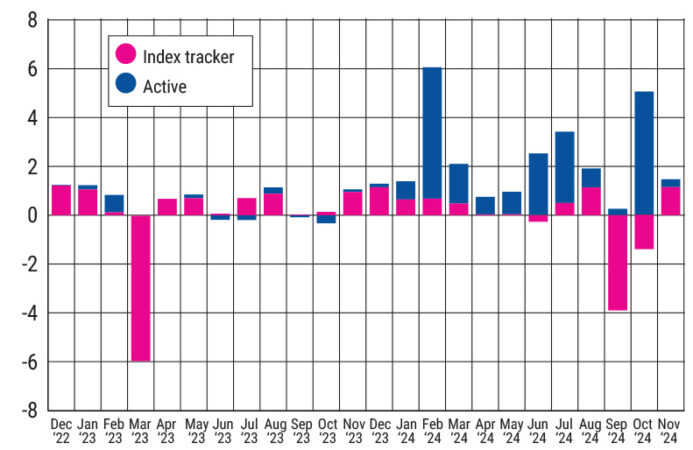
Over 12 months to the end of November, UK investors have put £21.3bn to work in Equity US mutual funds and ETFs. Given current market trends, you might expect the lion’s share of this to be going into passive vehicles. That’s not been what has happened, however. Although certain passive products have done well from the trend to US equities, in the round only £167m of that cash has gone to trackers. The rest is all active money.
See also: State Street: US the only region investors are overweight
Before continuing, however, a slight caveat: to complicate things, if you look at London Stock Exchange-listed ETF trades, things are a little different, with November flows to the classification spiking to new highs. On this metric, net flows were almost £14bn — or 244% of the last high, which was hit in October. But this will also include flows from other exchanges on which the ETFs are listed, so is a less UK-focused view. For whatever reason, a view across the UK mutual fund and ETF landscape gives a stronger active slant.
Monthly flows to Equity US funds, active versus passive, Dec 2022-Nov 2024, £bn

As you can see from the chart, Equity US fund flows pick up from October 2023 lows, and have remained positive, except for this September.
Why this should be is harder to fathom: the US is the world’s largest, most liquid and best covered market. It should, therefore, be the hardest place to add value through active management. It seems that those with the deepest pockets think differently.
I looked at the seven active funds that have attracted £1bn-plus over the past two years, to see what distinguished them. The obvious question is, have they delivered? That’s a hard one to answer, as five of the seven have been launched within the past year. The other two haven’t been around long enough to get three-year histories. However, net returns over 12 months are within a few basis points either way of the total return for the S&P 500 over the period.
See also: Trump tariffs: A looming disaster for the global economy?
The main driver of active to passive is, of course, cost. Only one of the seven has a Total Expense Ratio above the average for Equity US passive funds, and most are substantially lower. Given their high initial minimum investment levels, which strongly indicate institutional, that’s not too surprising.
So, we can safely say that investors are not buying into the record of the fund; they are buying the asset manager and the approach. In terms of the former, one is clearly dominant (no clues, but no prizes for guessing either), there being only two management companies over the seven funds.
Then there is the approach: five out of the seven carry ‘ESG’ in the name, while the other two have well-promoted sustainability-based exclusion policies. Flows to LSEG Lipper Research’s sustainable fund list shows a £17.8bn to relevant Equity US funds over the period: less than to the net flows for active funds, and less than to the top-seven money takers, but still well ahead of conventional peers.
To what degree each of these factors — active management, company reputation and sustainability policy — are driving flows cannot be determined from the raw numbers alone, but that these three stand out from the data cannot be coincidental.
Dewi John is head of research at LSEG Lipper
This story was written by our sister title, Portfolio Adviser


