As a concept, Risk is something we, as finance professionals, are well aware of and in general, concerned about. Given the (mis)behaviour of markets – SVB, Credit Suisse, First Republic notwithstanding – risk has suddenly become the catchphrase, or dare I say, the flavour of the month, writes Abhi Chatterjee, chief investment strategist at Dynamic Planner
We have often heard the saying “Nothing ventured, nothing gained”. This pithy saying captures the essence of investing – without risk, there is no reward. However, risk implies different things to different people.
While some perceive risk to be a permanent loss of capital, others consider the variability of returns as a measure of risk. Over time, we have developed metrics which help us quantify risk, so that it is understandable and communicable. In trying to do so, we have relied on mathematical models, borrowing ideas from different fields to develop and enrich the vocabulary of risk.
However, a fallout of this has been ever increasing complexity, resulting in a lack of clarity in the true understanding of what we are trying to communicate.
Statistically speaking, the variance of returns of an asset class, as measured by the standard deviation, has become synonymous with risk since being introduced by Harry Markowitz in his seminal work on Portfolio Selection in 1952.
Incidentally, the paper, which won him the Nobel Prize for Economics in 1990, has no mention of the word “risk” in describing his investment strategy. He simply identifies that variance of returns is an “undesirable thing” that investors try to minimise.
Fast forward to the present day, the concept is mathematically linked to the standard deviation – the greater the variance or the standard deviation around the average, the less the average return will signify about what the outcome is likely to be.
Ground-breaking as the theory was, matters of practicality played a very important role in the implementation of the measure. Markowitz assumed that that practitioners would have no difficulty estimating the inputs to the model—expected returns, variances, and the covariances among all the individual holdings or asset classes.
However, to estimate these inputs, practitioners need to rely heavily on historical data. Consider historical data before the great financial crisis of 2008 – estimating inputs like volatility depends on decisions as to whether we include or exclude data during the event. The outcome of this decision results in a significant variation in the estimates.
Another issue stems from the idea that the returns on each asset, or for that matter a security, can be described with only two numbers: expected return and variance. Dependence on just those two numbers is appropriate if, and only if, security returns are normally distributed like the Bell curve, as described by Gauss.
Under such a distribution, no outliers are permitted, and the array of results on either side of the mean must be symmetrically distributed. When the data are not normally distributed, the variance may fail to reflect the full scope of the uncertainties in the portfolio. We come across this issue often.
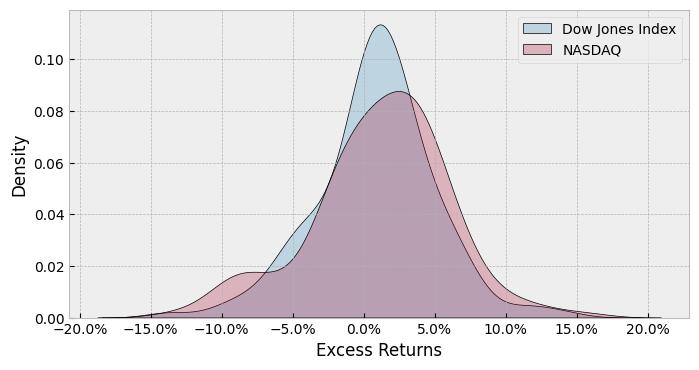
Consider a simple example as in Figure 1 – it shows the distribution of monthly observed returns of the Dow Jones Industrial Average against the NASDAQ Composite Index. As all practitioners are aware, the Dow is composed of 30 of the most analysed and followed stocks, while the NASDAQ contains stocks of high growth, smaller companies. A quick inspection of the two distributions informs us that none of the distributions have the typical symmetric characteristics of the bell curve.
Figure 1: Distribution of Monthly Returns of Dow Jones Industrial Average Index and Nasdaq Composite Index

Source: Dynamic Planner
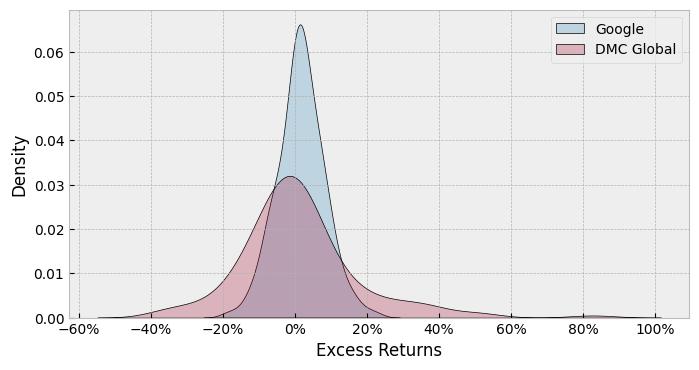
However, the Dow is a closer approximation than the Nasdaq index, which has much larger left tails, signifying a greater probability of large negative performance than the Dow. Thus, using a measure which relies on a symmetric distribution does not do justice to the risks posed by holding such an asset. This issue gets exacerbated as we delve into thinly traded stocks – as the example in Figure 2, which are the distributions of Google and DMC Global, a well-known Large Cap and Small Cap stock.
Figure 2: Distributions of monthly returns of Google and DMC Global

Source: Dynamic Planner
As can be seen, DMC Global has a bigger variation of returns along with a greater probability of large negative returns in comparison to the returns of Google. The second example provides an insight into the nature of instruments and their range of the prices.
Nevertheless, volatility, or variance, has an intuitive appeal as a proxy for risk. Statistical analysis confirms what intuition suggests: most of the time, an increase in volatility is associated with a decline in the price of the asset. Moreover, intuition and experience tell us that uncertainty should be associated with something whose value jumps around a lot over a wide range.
Yet there is no strong agreement on what causes volatility to fluctuate or even on what causes it in the first place. The only thing certain about volatility is that it sets in when the unexpected happens. But that is of no help, because, by definition, nobody knows how to predict the unexpected. On the other hand, not everyone worries about volatility. Even though risk means that more things can happen than will happen—a definition that captures the idea of volatility—that statement specifies no time dimension.
Once we introduce the element of time, the linkage between risk and volatility begins to diminish. Time changes risk in many ways, not just in its relation to volatility, which leads us on to various other measures of risk.
While volatility remains the preferred measure of risk, delving into its mechanics and nuances can help us navigate uncertainty with a degree of comfort.
This article was written for International Adviser by Abhi Chatterjee, chief investment strategist at Dynamic Planner.


